Troubleshooting
Tracing and Logging
Configuring Neuron Tracing
Neuron includes tracing functionality that can assist in diagnosing communication issues. To enable full tracing, use the “Configure Server” dialog in Neuron Explorer and set the Trace Level to “Trace errors + warnings + info + verbose.”
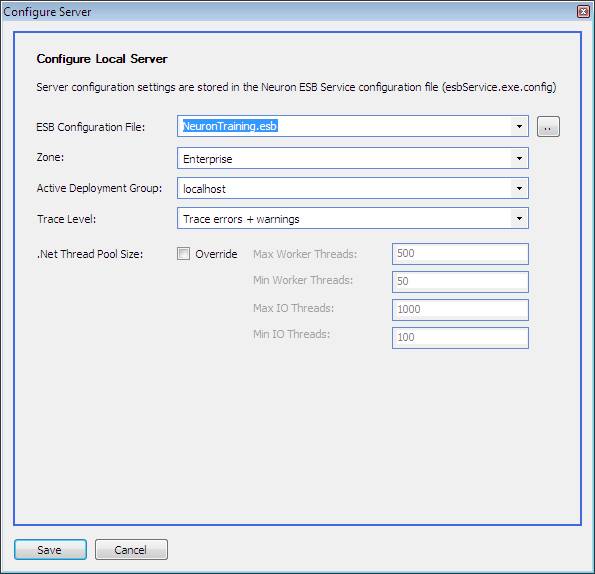
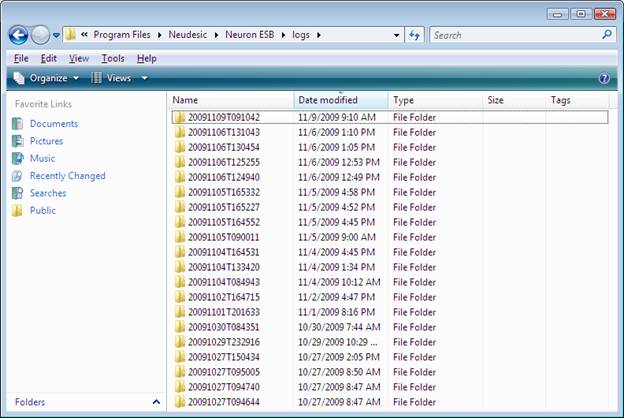
When Neuron starts, a timestamped folder will be created inside the logs folder of your installation path. Each system service, adapter, topic, and service connector will create a unique file to contain for its tracing information. The trace level will determine the level of detail written to the log files.
Enabling verbose logging will log messages received and sent by service and client connectors and significantly increases the size of the log files. This setting should be used with caution in production environments.
Configuring WCF Tracing
In rare cases, troubleshooting an issue may require more information than is provided in the standard Neuron logs. WCF contains extensive tracing support that can be used to troubleshoot more complex communication problems with TCP topics, MSMQ topics, Peer topics and Client and Service Connectors.
Information about enabling WCF tracing can be found on MSDN: http://msdn.microsoft.com/en-us/library/ms733025.aspx
Neuron ESB Event Log
Additional tracing and diagnostic information can be found in the
Neuron ESB event log. The information in the event logs corresponds
to the active trace level. Refer to the Configuring Neuron Tracing
section for information regarding configuring the active trace level.
Troubleshooting Topics
General
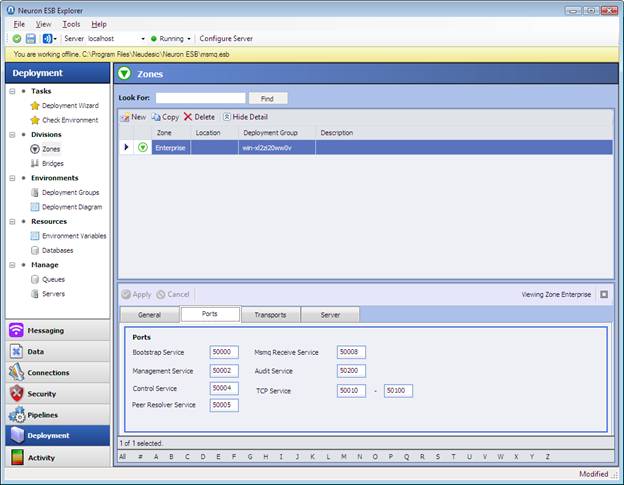
For each deployment zone, a number of system ports can be configured. Each server should have these ports open for incoming traffic in its firewall configuration so that it can receive messages.
Service Identity
If running the Neuron ESB service with a custom account, a valid service identity must be configured in order for clients to connect to the bootstrap service. See Configuring Client Access for information about configuration service identity.
TCP
Ensure that all required ports are open on both the client and server. In addition to system ports such as the bootstrap service port, TCP topics require network traffic to flow in both directions between the client and the server. The specific ports used by each TCP topic can be located on the Networking tab for the topic.
| Value | Description |
| Client port base | The starting port number for inbound TCP traffic on client machines. |
| Client port range | Specifies the number of ports to reserve for inbound TCP traffic on client machines. Clients must be able to receive TCP traffic on this port range (from client port base to client port base + client port range) and the server must have the ability to send traffic to this port range. |
| Service port | Specifies the port by the server for the TCP publishing service. The server must have the ability to receive TCP traffic on this port and clients must have the ability to send TCP traffic to this port. |
The Neuron event logs may contain information to aid in diagnosing communication problems.
MSMQ
Ensure that MSMQ is installed on all client and server machines that will be using MSMQ topics.
If attempting to read from transactional queues from a remote machine, Windows 2008 (or Vista) or higher is required. If using earlier versions of Windows the recommended approach is to use mapped queues so that all reads are local. See the MSMQ Topic documentation for additional information.
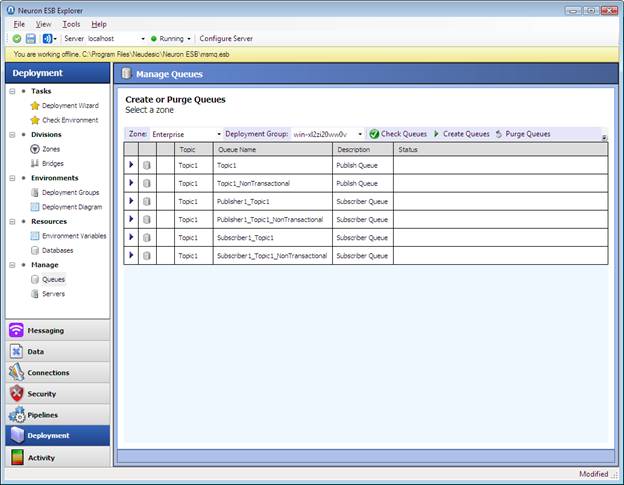
Ensure that all queues have been created. In Neuron Explorer, you can check and create topic queues from the Queues menu item on the Deployment tab.
Verify permissions on MSMQ topic queues. The “Anonymous Logon” use should have permission to send and receive messages on each queue.
Verify that the firewall settings are properly configured for MSMQ (http://support.microsoft.com/kb/183293, http://support.microsoft.com/kb/178517/EN-US/).
If a problem was encountered when attempting to access queues, the publishing service may need to be restarted. To restart the publishing service, restart the Neuron ESB service.
If the application is configured to use transactional queues, try using non transactional queues. If non-transactional queues function then MSDTC may be configured improperly or the firewall may be blocking MSDTC traffic (http://support.microsoft.com/kb/306843)
The Neuron event logs may contain information to aid in diagnosing communication problems.
Peer
Ensure that the resolver service port is open on the Neuron server firewall. The port used by the resolver service can be configured on the zone ports tab.
Ensure that the client port range is open for send and receive on machines that will be connecting to topics using the peer transport. The client port base and client port range can be specified on the Networking tab of the topic properties.
The Neuron event logs may contain information to aid in diagnosing
communication problems.
Troubleshooting Services and Adapters
Endpoint Health
The status of individual service connectors and adapters can be monitored from the Endpoint Health screen.
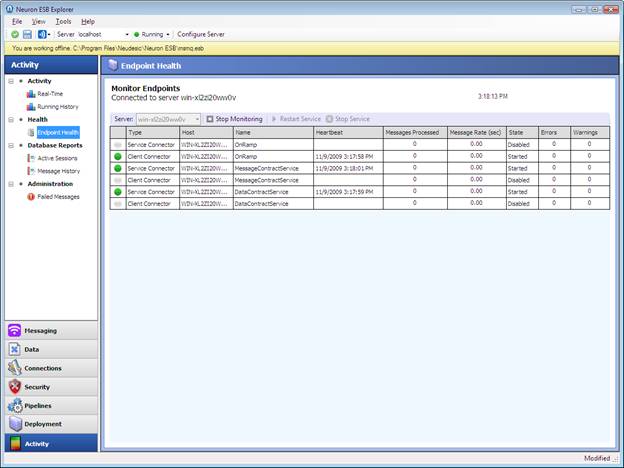
Disabled endpoints will be marked by a grey icon, endpoints running without errors will be marked with a green icon, and endpoints encountering errors will be marked with a red icon. The status column lists the state of the service. Ensure that required endpoints are listed in the started state. Individual endpoints can be started and stopped from within the endpoint health screen.
If an endpoint is encountering errors, follow the steps described in the Logging and Tracing section to obtain more detailed information.