REST and WMI enabled Endpoint Health Monitoring
REST Interfaces
Neuron ESB 3.5 exposes much of its monitoring and server management functions through REST based interfaces. These interfaces can be used to extend and build custom monitoring and management solutions for Neuron ESB Deployments. The Neuron ESB 3.5 REST interfaces are hosted by the Neuron ESB Discovery service (DiscoveryService.exe) which is installed with the Neuron ESB Server Runtime. The default port (51002) for the REST interfaces is configurable through the Neuron ESB Discovery service’s app.config. The default installation location of the Neuron ESB Discovery service is : “C:\Program Files (x86)\Neudesic\Neuron ESB v3”.
The Neuron ESB REST interface documentation can be found at the default URL, http://localhost:51002/help/index.
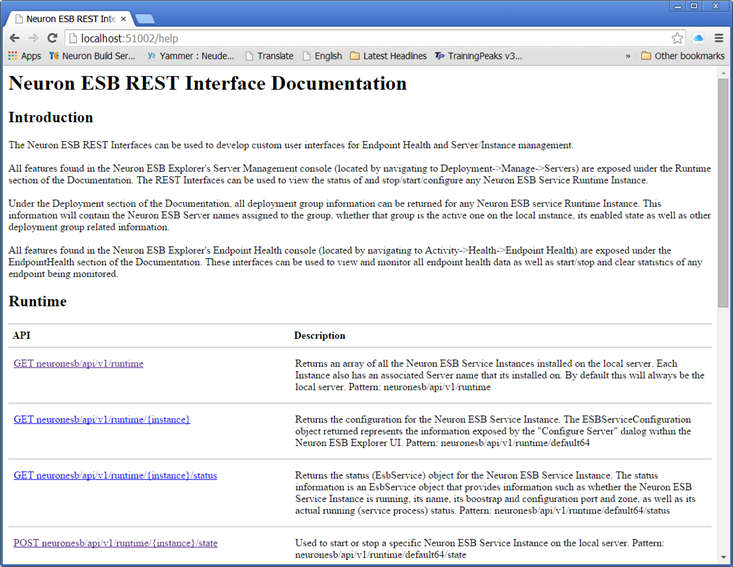
The REST interfaces are self-documenting, providing detailed instructions on how to call each specific function and are separated into the following categories:
- Runtime
- Deployment
- Endpoint Health
- Activity
Runtime
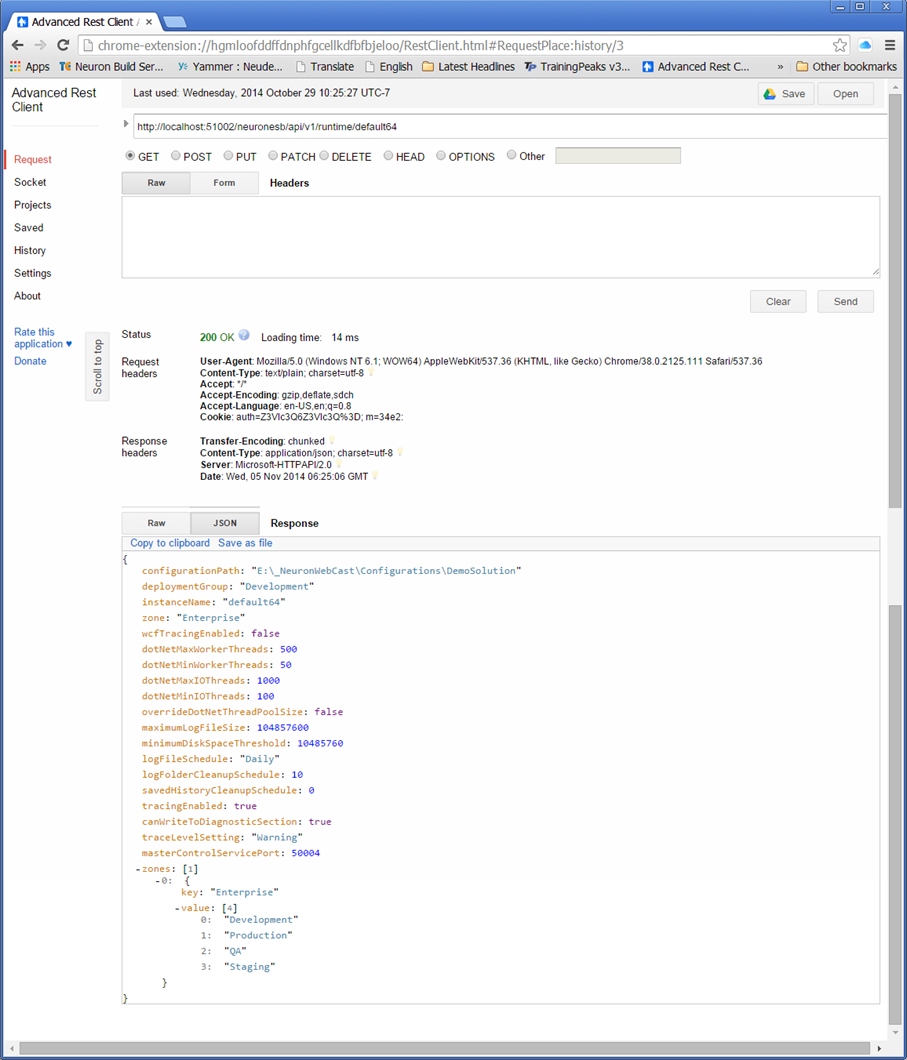
All features found in the Neuron ESB Explorer’s Server Management console (located by navigating to Deployment->Manage->Servers) are exposed under the Runtime section of the Documentation. The REST Interfaces can be used to view the status of and stop/start/reconfigure any Neuron ESB Service Runtime Instance. Several interfaces are exposed including:
GET
- neuronesb/api/v1/runtime
- neuronesb/api/v1/runtime/{instance}
- neuronesb/api/v1/runtime/{instance}/status
POST
- neuronesb/api/v1/runtime/{instance}/state
- neuronesb/api/v1/runtime/{instance}/config
Using these interfaces, users can find all instances of the Neuron ESB Runtime on a specific server, retrieve their respective solution configuration, and then use the Deployment REST interface to determine exactly what servers the solution is deployed to and how it is configured across the various environments.
Deployment
All deployment group information can be returned for any Neuron ESB service Runtime Instance. This information will contain the Neuron ESB Server names assigned to the group, whether that group is the active one on the local instance, its enabled state as well as other deployment group related information.
A single interface is exposed:
GET
- neuronesb/api/v1/deployment/{instance}
Endpoint Health
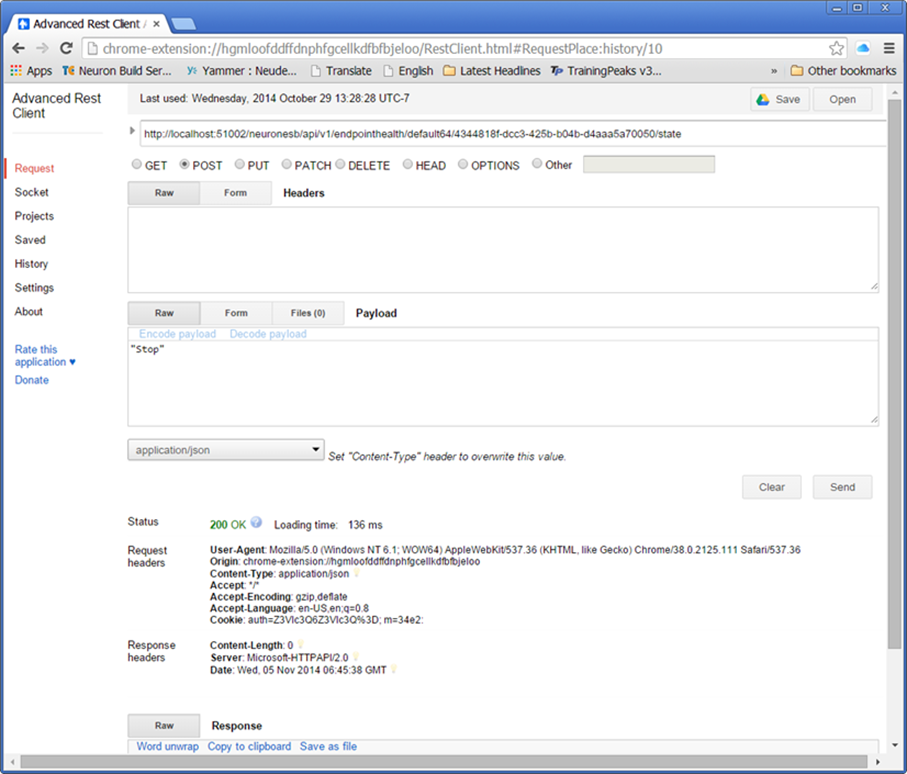
All features found in the Neuron ESB Explorer’s Endpoint Health console (located by navigating to Activity->Health->Endpoint Health) are exposed under the Endpoint Health section of the Documentation. These interfaces can be used to view and monitor all endpoint health data as well as start/stop and clear statistics of any endpoint being monitored such as a Topic, Adapter Endpoint, Service Endpoint, Availability Group and Workflow Endpoint.
Two interfaces are exposed:
GET
- neuronesb/api/v1/endpointhealth/{instance}
POST
- neuronesb/api/v1/endpointhealth/{instance}/{id}/state
An example of using these together would be to first retrieve the ID of the endpoint to Stop or Start using the GET interface. Once the ID is retrieved it could be passed to the PUT interface to either Stop or Start the endpoint.
Activity
The Activity REST interface provides users the ability to query Neuron ESB and retrieve any message logged to the Failed Message Audit table by its message id.
A single interface is exposed:
GET
- neuronesb/api/v1/Activity/{instance}/{messageid}
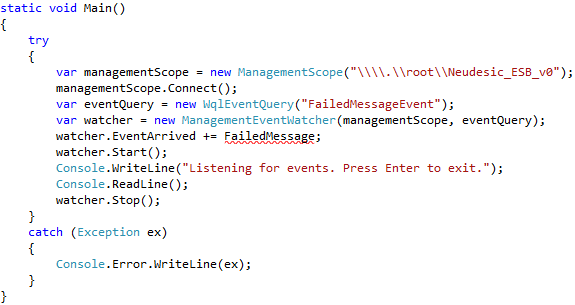
For example, a user could use Windows Management Instrumentation (WMI) to monitor Neuron ESB for Failed Messages and, alternatively use REST to retrieve the message body if the message was larger than 1MB in size. Once the message body is retrieved, it could be published back to Neuron ESB using the client API for further processing or to generate notifications.
The first step: setup the monitoring of the WMI event:
The second step: capture the FailedMessage event:
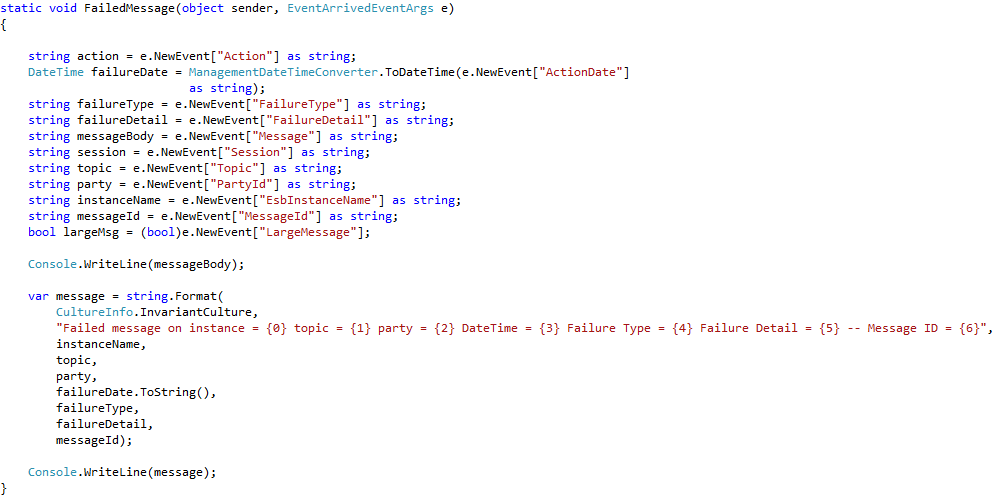
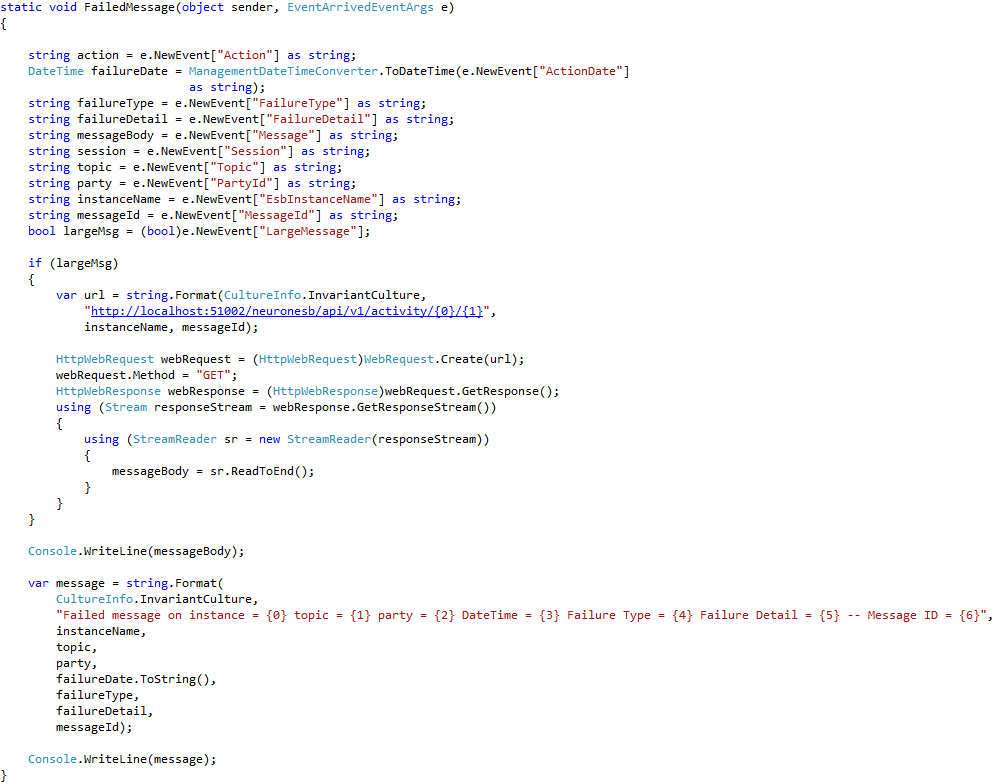
The last step: include the conditional logic to call the Neuron ESB Rest interface if the message body was too large for the event to return:
Windows Management Instrumentation (WMI)
Neuron ESB 3.5 introduces a new WMI event that allows users to monitor state changes that occur in any Adapter or Service Endpoint (Client or Service Connector). Historically, users would monitor these state changes through the Neuron ESB Explorer’s Endpoint Health. However, WMI allows users to build extended monitoring solutions without the need to reference Neuron ESB specific assemblies.
For example, using the WMI event, a solution could be developed to detect when an endpoint goes offline. When it does, a notification could be sent or, the Neuron ESB REST interface could be used to automate the restart of the endpoint.
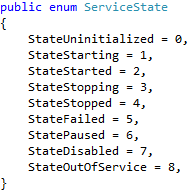
The following states are reported by the WMI event. These are the same state events reported within Endpoint Health.
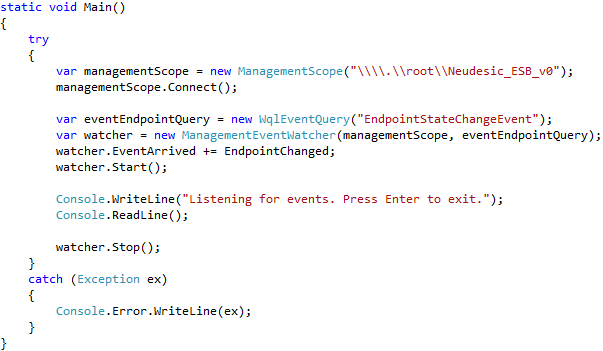
Initializing and monitoring the event (EndpointStateChangeEvent) is similar to that of the Neuron ESB FailedMessageEvent WMI event:
Capturing the EndpointChanged event:
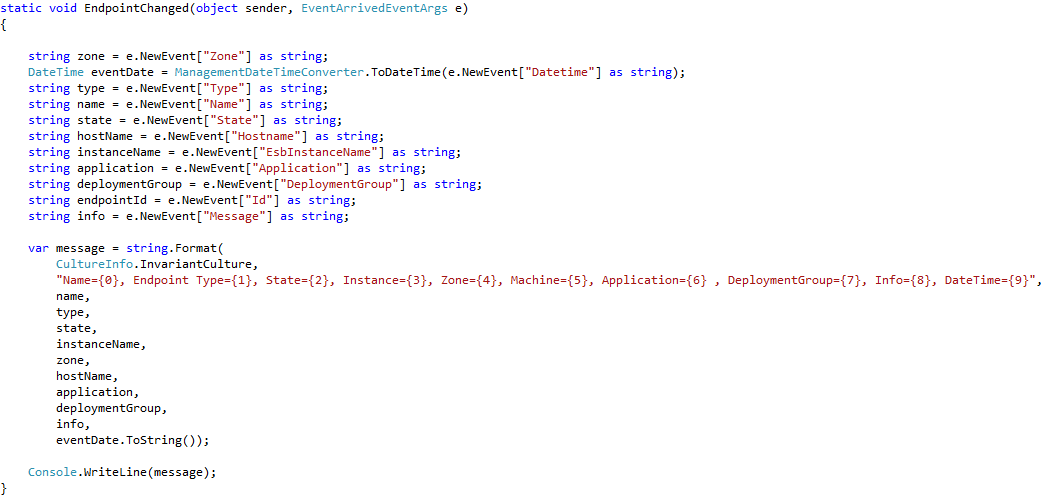
As seen in the example above, a number of properties are exposed by the WMI event, including Type and Message. The Type property can be one of 3 possible values:
- ClientConnector
- ServiceConnector
- AdapterEndpoint
The Message property will only be populated if a failure occurred with the endpoint. In that case, the Message property will contain the entire System.Exception message.
Using the Type property, the original WMI query could be modified to only monitor endpoints of a specific type using the Condition property:
