Developer Productivity and Business Processes
Intro
Neuron ESB has always provided a way for developers to test the Business Processes that are created within the Neuron ESB Explorer’s Process Designer. Testing entailed submitting a message using the “Edit Test Message” dialog and watching, as each Process Step in the Business Process executed. Users would see a green marker move through the Business Process, highlighting each Process Step as it was executed. However, the testing process lacked true debugging support. For example, there was no way to stop at a specific point in the Business Process and actually inspect the state and context of the Process and/or a specific Process Step. There was no way to debug custom code written within a C# Code Process Step. This required developers to insert custom trace and logging statements prior to testing. There was also no ability to disable branches or Process Steps within a Process. If extra Process Steps were included during testing, these would have to be removed from the Process before deployment.
Neuron ESB 3.1 introduces true Business Process debugging support at design time so that developers can quickly test, diagnose and fix the Business Processes AS they are developing them. The Business Process debugging experience within Neuron ESB 3.1 is synonymous to the experience provided by Microsoft Visual Studio for debugging .NET applications. For example, developers can set Breakpoints, disable Process Steps, use F5/F10/F11 keys, view exceptions and view the context of the Process and Process Steps.
Breakpoints
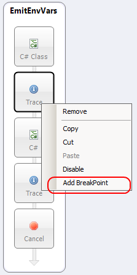
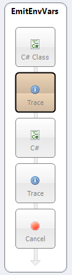
Setting Breakpoints is easy, intuitive and can be set on both on Process Steps as well as within any code editor belonging to a C#, C# Class and VB.NET Process Step. Within a Business Process, Breakpoints can be set on any Process Step and selecting “Add BreakPoint” from the context menu. Once a breakpoint is added, the Process Step will change to a reddish brown color. To retain all Breakpoints between opening and closing of the Business Process, the Process must be saved.
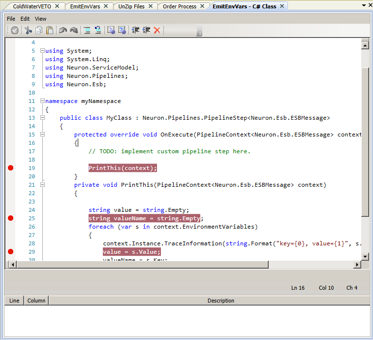
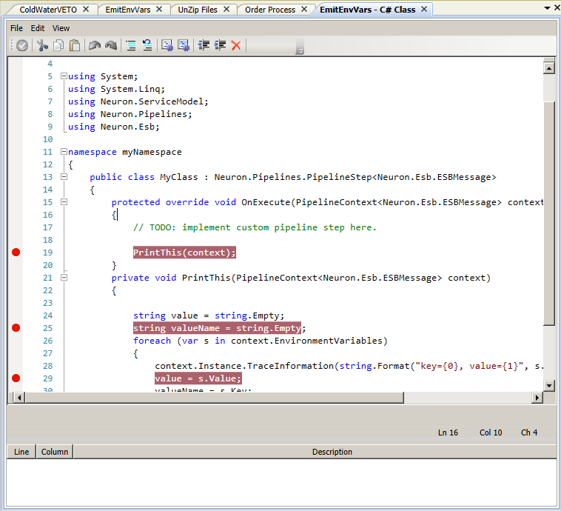
Within a VB.NET, C# or C# Class Code Editor, setting Breakpoints is as easy as clicking to the left of the line of code that the debugger should stop on. A red dot will be displayed to the left of the line of code (Breakpoint Indicator Margin) and the line of code will be highlighted in red.
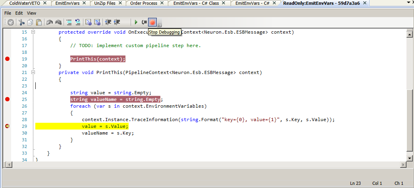
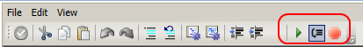
Once a Breakpoint is set and the debugging process has started (by selecting the new “Start/Resume Debugging” toolbar button), the green marker will move to the first Process Step that has a Breakpoint. Once the green marker moves to a Code Process Step (whether or not it has a Process Step level Breakpoint set on it) that has Breakpoints set within its Code Editor, the debugger will automatically open the Code Editor and stop on the line of code that has the Breakpoint. The line stopped on will be highlighted in yellow and the debug toolbar of the Code Editor will appear.
From there, F5 (continue), F10 (step over) or F11 (step into) keys can be used to walk through each line of code in the editor. The debugger can also be stopped by clicking the “Stop Debugging” toolbar button (F1 key). Once on the last line and F5 (or the continue toolbar button is pressed) the debugger will move to the next Process Step that has a Breakpoint set on it.
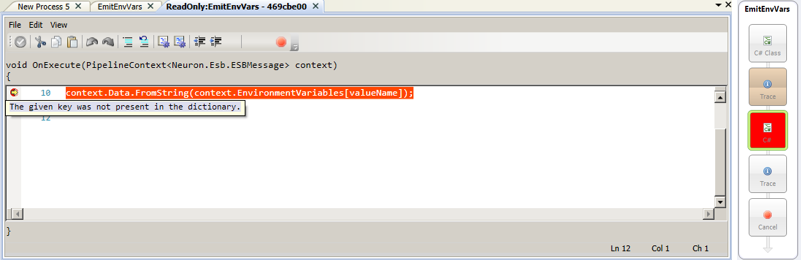
If an unhandled exception occurs, the line will immediately be highlighted in orange. By moving the mouse cursor over the Breakpoint Indicator Margin to the left of the line of code, a tooltip will appear with the error message. If an unhandled exception occurs on a Process Step, the debugger will stop on that Step and highlight it in red. The exception information can be viewed in the Trace Window.
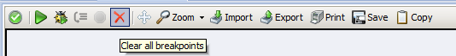
To remove all Breakpoints in a Code Step, there’s a red “X” icon on the toolbar. It clears all Breakpoints. The Process Designer has a similar toolbar button that does the same, but for Process Steps.
Disabling Process Steps
Disabling Process Steps has been enabled for both design time and runtime environments. If a user disables a Process Step, that Process Step will be stepped over and not executed, either when testing in the Process Designer or at runtime.
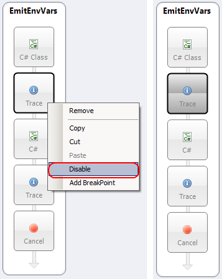
Within a Business Process, disabling a Process Step is as easy as selecting “Disable” from the context menu. Once a Process Step is disabled, the Process Step will change to a dark grew color. To retain the disabled condition at runtime, the Business Process must be saved.
Quick Watch Window
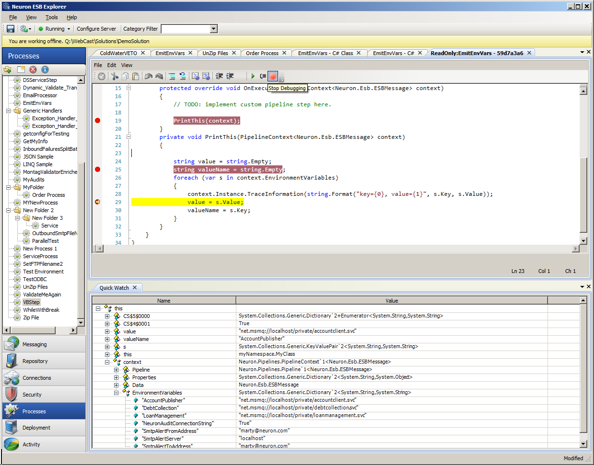
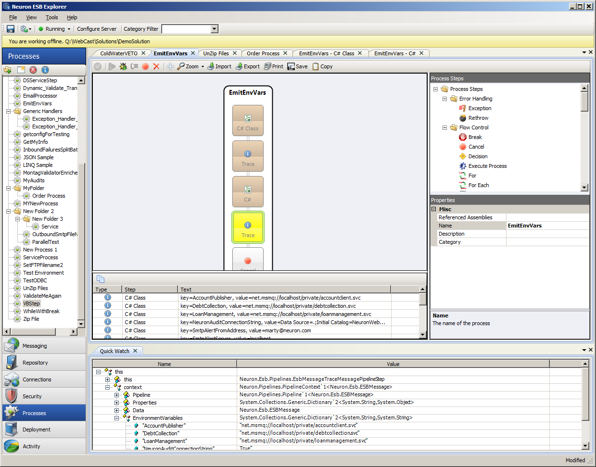
Neuron ESB 3.1 introduces support for a Quick Watch window that provides the ability for developers to view local variable information (much like Microsoft Visual Studio Auto window). If a Breakpoint is hit during the debugging process, the state of the ESB Message can be evaluated in the Quick Watch.
The state of custom variables, Environment Variables and various context properties like context.Data.Properties, context.Properties, context.States, etc. can also be examined as the user steps through each Process Step within a Process.
Tabbed View of Business Processes
In previous versions of Neuron ESB, only one Business Process could be opened within the Process Designer at time in order to be worked on. If a user needed to copy elements of one process over to another, the first process would have to be closed before the second process could be opened and viewed.
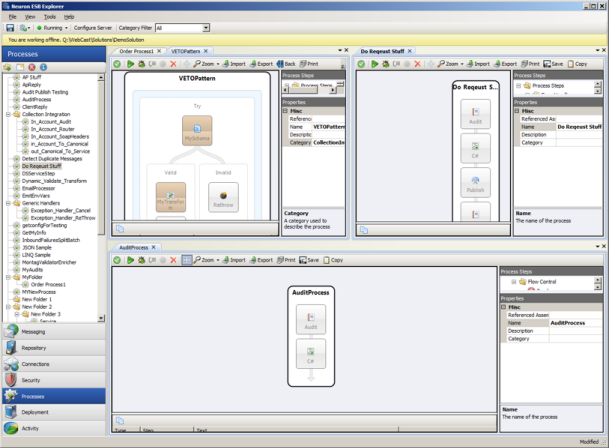
Neuron ESB 3.1 introduces a new Tabbed Dialog view of Processes within the Process Designer. This allows multiple Processes to be opened at the same time, allowing the user to navigate between them all by simply selecting their respective tabs. Additionally, the tabs are dock able and detachable, allowing several processes to be arranged within the same window.
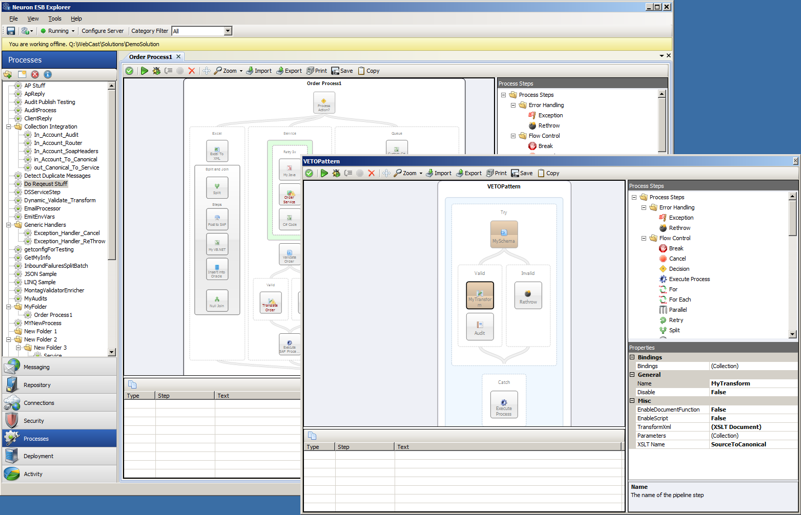
Or processes can be detached and worked on in dedicated windows:
Lastly, when a user navigates to another part of the Neuron ESB Explorer to work on any other part of the solution and later navigates back to the Process Designer, all previously opened Processes will still be opened in their respective tabs and locations. If there was a test message submitted for a specific process using the “Edit Test Message” dialog, that message will still be maintained and loaded in the “Edit Test Message” dialog when used with the specific Process.
Tabbed View of Language Code Editors
In previous versions of Neuron ESB, the C# Code Process Step opened as a Modal window within the Neuron ESB Explorer. This required users to close the editor before any other activity could be done within the Neuron ESB Explorer.
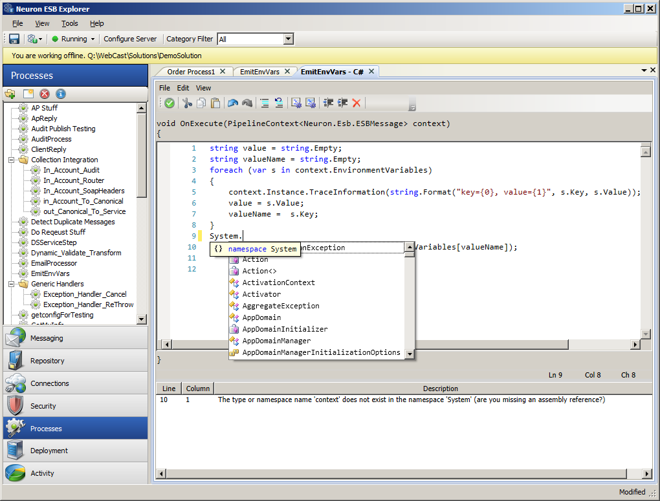
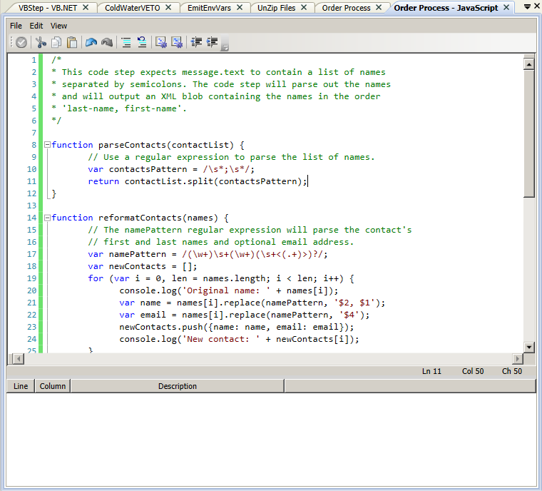
Neuron ESB 3.1 adds the Code Editors to the same shared Tabbed Dialog view that the Processes use. Now multiple Code editors (JavaScript, C#, C# Class and VB.NET) can be opened side by side in their own tabs, allowing users to navigate easily between Code Editors and Processes
Extended Language Support
Neuron ESB 3.1 introduces support for new languages as well as expanded support for C# and the overall code writing experience. Users can now write VB.NET, JavaScript or full C# classes directly within a Business Process without any need to generate and reference .NET assemblies. All languages are represented by individual process steps under the Languages folder of the Process Step library
A new developer toolbar has been included with all the Code Steps
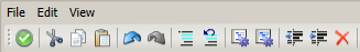
This provides developers access to common tasks such as undo, comment, format, indent, delete all breakpoints, add assembly references, display line numbers, etc.
We have also added support for adding breakpoints on a specific line of C# (within the C# or C# Class Code Steps) and VB.NET Code Step. Developers can add breakpoints on code lines which will cause the Neuron ESB debugger to stop on the specific line when it hits, similar to what developers experience within Microsoft Visual Studio. Once broken into the debugger, a modified Toolbar will appear allowing the user to continue, step over or stop the debugging process. While in Debug mode, developers can view the state of context and process within the Debug Window.
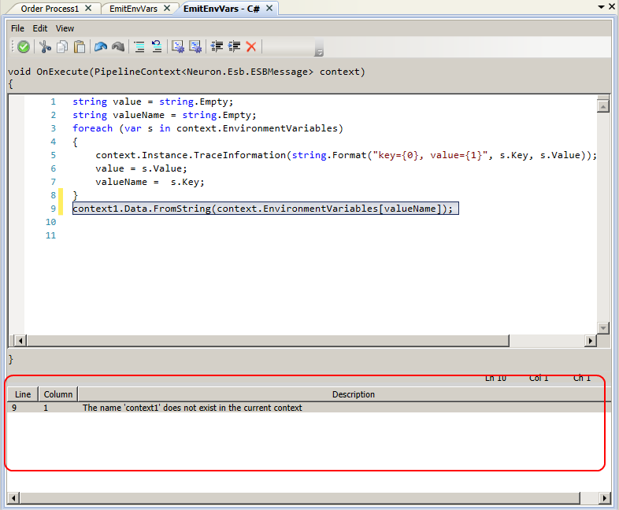
Also, a new compile window has been added to all the Code Steps that allow users to see the design time compile error, line number and column where the error is occurring as shown in the C# Code Editor Image below:
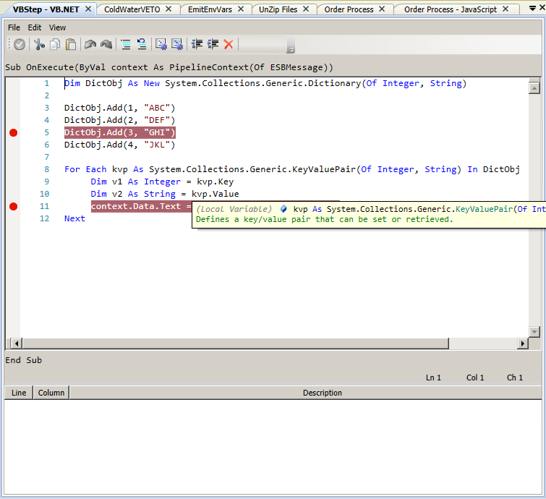
VB.NET
Writing VB.NET code within a Process is as simple as dragging the VB.NET Code Step onto the Process Designer, right click and selecting edit. Users will receive the same experience as if using the C# Code Step:
JavaScript
Writing JavaScript directly in a Process is just as easy. Drag a JavaScript Code Step directly onto the surface of the Process Designer, right click and select edit to open the Code Editor:
C# Classes
The new C# Class Code Step offers some advantages over the existing C# Code Step that previously shipped with Neuron ESB. The C# Class offers developers a way to more easily organize their code, reducing its complexity. It also allows developers to add using statements and define their own name spaces and new classes. The C# Class Code Step provides an existing template that developers can modify by changing the namespace and class names. From there developers can add additional methods or new classes:
Category and Descriptions
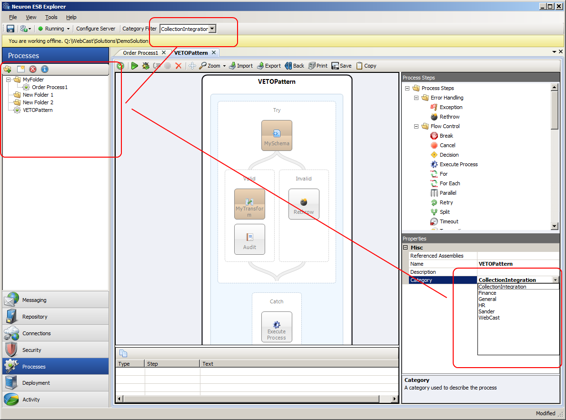
All processes now have both a category and description property. If assigned a category, the category selected in the Category Filter toolbar dropdown of the Neuron ESB Explorer will automatically filter the view of processes in the Process Library.
Business Process Folders
Users can now create folders to organize and store their processes in. An “Add Folder” button has been added to the Process library toolbar. Sub folders can be created by right clicking on an existing folder and selecting “Create Folder” from the context menu. Users can also rename the folder by simply clicking on the name and in the process library for it to become editable.
Once folders are created, existing processes can be dragged and dropped into the folders. Once the folder organization is complete, the solution must be saved.
Business Process Step Folders
In Neuron ESB 3.1 all process steps have be reorganized into a folder hierarchy with the following categories (folders). All new process steps are highlighted in red italics:
| Process Step Folder | Process Step |
| Error Handling | ExceptionRethrow |
| Flow Control | BreakCancelDecisionExecute ProcessForFor EachParallelRetrySplitTimeoutTransactionWhile |
| Languages | C#C# ClassJavaScriptVB.NET |
| Message | AuditCompressionDetect DuplicatesExcel to XMLJSONPopPushSet PropertyTrace |
| Security | Decrypt XMLEncrypt XMLSign XMLVerify Signed XML |
| Services | PublishRules – WFServiceWorkflow |
| Storage | MSMQODBCStoreTable QueryXml Query |
| XML | Transform – XSLTValidate – Schema |
Business Process Navigation
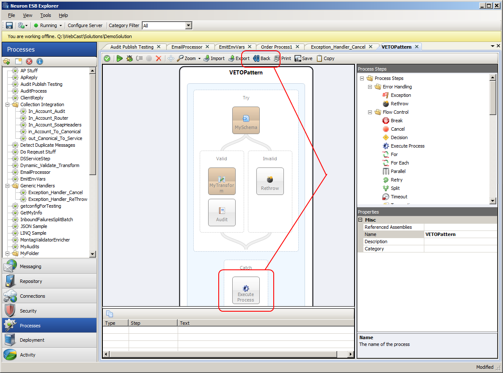
Reusable processes are an important development pattern. Neuron ESB Processes can be reused/called by other existing processes by using the Process Execution Process Step. If a user double clicks on this Process Step, the Process that it calls will be displayed along with a Back button on the toolbar. This provides the developer a way to easily navigate back and forth between parent and child processes.
Business Process Printing and Save Image
All processes within the Neuron ESB Process Designer can now be saved as a JPEG or Printed as a report through the new Process Designer’s toolbar:
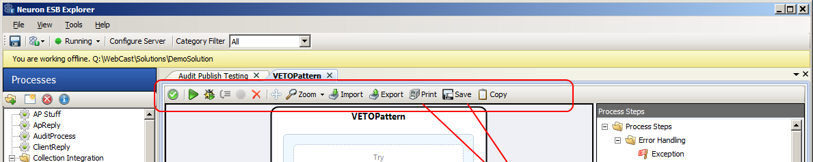
Clicking the “Save” button will prompt the user for a location to save the JPEG image of the process to.
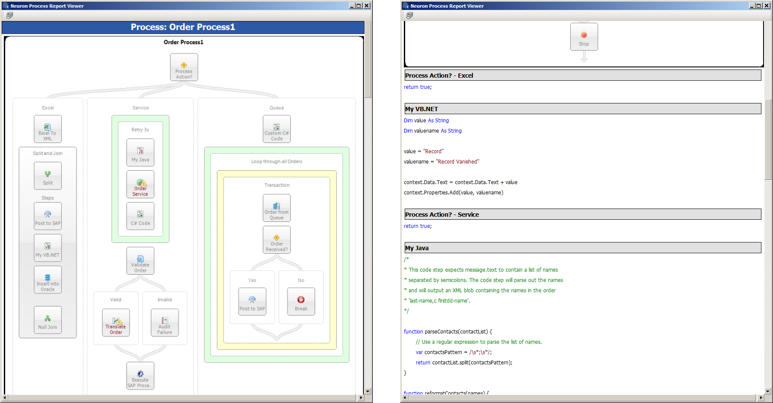
Clicking the “Print” button will display a Print Preview form with an image of the process along with any custom code that any Process Step may contain. All custom code is separated in the report by the name of the Process step that contains it and is formatted with Rich Text.
Business Process Steps
Extended Design Time Testing Support
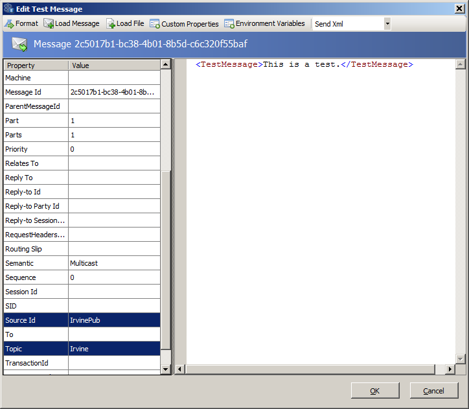
In Previous versions of Neuron ESB, almost all Process Steps could be tested directly in the Process Designer with the exception of the Audit and Publish Steps. In Neuron ESB 3.1, the Audit and Publish process steps have been modified to support design time debugging within the Neuron ESB Business Process Designer. The only requirement is that the solution which is to be tested must be hosted and running in a Neuron ESB runtime on the local machine. The Neuron ESB Explorer can be opened in either online or offline mode for this to work. Additionally, when submitting a message to test, a valid SourceId and Topic must be provided in the “Edit Test Message” dialog. These are used to create a connection to the live Neuron ESB runtime service hosting the solution:
Extended Xml Schema Validation Process Step
In previous versions of Neuron ESB the “Validate-Schema” process step only supported file based locations for the “schemaLocation” attribute for schemas that contained import or include references. For example, when a WSDL is downloaded, the schemas included in that WSDL will often import from a different schema, using a “schemaLocation” attribute to direct the schema parser on where to find it. Neuron ESB previously only supported a file-based location, such as this:
<xsd:schema xmlns="http://www.w3.org/2001/XMLSchema" elementFormDefault="qualified" xmlns:xsd="http://www.w3.org/2001/XMLSchema">
<xsd:import schemaLocation="C:\SchemaS\Account_sObject" namespace="urn:sobject.partner.soap.sforce.com" />
At runtime, if there was a Validate-Schema process step, the import (or include) would be resolved to the local file system.
In Neuron ESB 3.1 support has been added to resolve schema locations to the ESB Repository, like this:
<xsd:schema xmlns="http://www.w3.org/2001/XMLSchema" elementFormDefault="qualified" xmlns:xsd="http://www.w3.org/2001/XMLSchema">
<xsd:import schemaLocation=”esb:Account_sObject” namespace=”urn:sobject.partner.soap.sforce.com” />
At runtime, if the schemaLocation attribute starts with esb: Neuron ESB will look for the schema in the configuration’s repository. The name following the esb: is the name of the schema in the repository.
Exception Pattern built into Audit Process Step
In previous versions of Neuron ESB, users were encouraged to adopt a reusable exception management pattern to employ in all of their processes. Generally this would entail creating a generic process that would handle and audit the exception and that process could be called from the Catch block of any other process using the Process Execution process step. Part of that pattern included the enrichment of the original exception using a C# Code Process step similar to this:
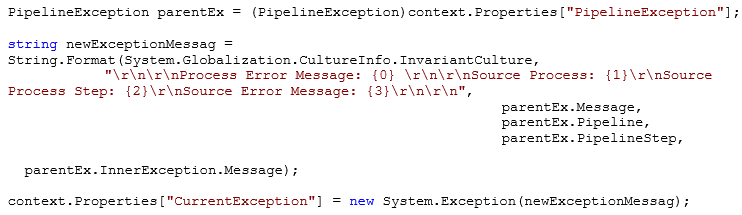
With Neuron ESB 3.1 this is no longer necessary. When a failure occurs and the message is audited using the Audit process step, the parent process name, source process name (where the error occurred) and the process step name that generated the exception are now captured. Also, the appropriate inner exception is retrieved if a child process generated the exception. All of this information is now recorded in the Failed Message Report and can be viewed in the Message Viewer.
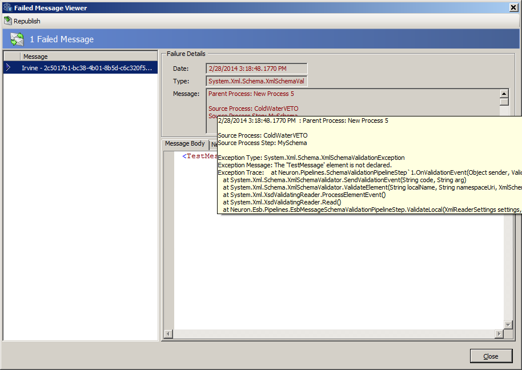
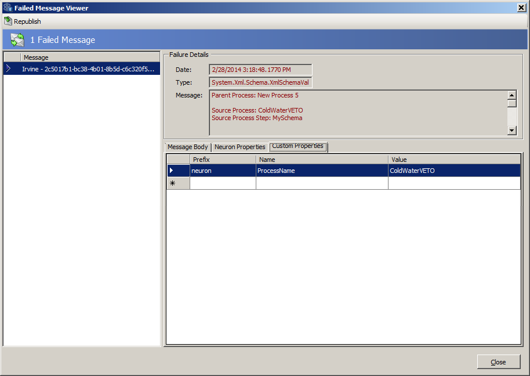
The source process name (where the error occurred is also captured within the database as a custom property when using the Audit Process Step in Failure mode (action property).
When using the Audit Process step in either Receive or Send mode (action property), the property will contain the name of the current process the Audit Process step is executing in.
Simplifying Pop/Push Process Steps
The Pop and Push Process Steps allow users to simplify the saving and restoration of a message at runtime within a Business Process. In many occasions, it may be desirable to save the original incoming message (Push) before it is transformed, enriched or otherwise changed as part of the process and when finished, restore (Pop) the message to its original state.
In previous versions of Neuron ESB, developers would be required to use a C# Code Step directly following the Push Process Step. This Code Step would have one line of code i.e.:
context.Data = context.Data.Clone(true);
In Neuron ESB 3.1 this is no longer required.
Extending the Service Process Step
In Neuron ESB 3.1 the Service Process Step has been extended to support WSDL extensions as well as maintaining its current support for WCF “Metadata Exchange Endpoints”. In previous versions of Neuron ESB, if the either the Metadata Url property was used or, a user selected to import the metadata by selecting “Select Endpoint…” from the context menu, only “Metadata Exchange Endpoints” could be used.
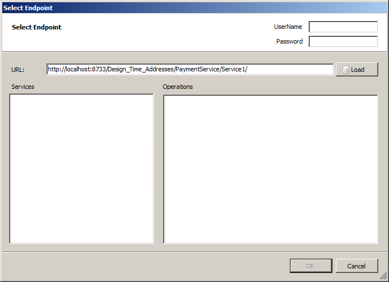
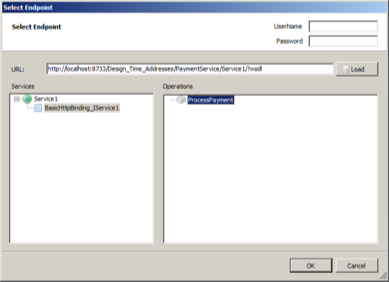
In Neuron ESB 3.1, WSDL support has been added, allowing non WCF services to be easily accessed through use of WSDL at runtime. If using the Select Endpoint metadata wizard (displayed below), if an endpoint is entered without either a WSDL or Metadata Exchange Endpoint, WSDL will be assumed and that extension will be automatically entered for the user:
Also, if a WSDL or Metadata Exchange Endpoint is not found, an error will be displayed to the user. In previous versions of Neuron ESB, the wizard would silently fail, displaying no error at all.
Lastly, the Service Process Step can still be manually configured to call any WCF or NON WCF service endpoint using its associated property grid. This allows service calls to be made without have to retrieve and parse the Metadata for each call.
New Timeout Process Step
The Timeout Process Step executes the contained Process Steps on a background thread. To succeed, the contained Process Steps needs to complete successfully before the timeout period expires, otherwise a timeout exception will be raised on the Business Process.
For example, if the Timeout Process Step is configured for 5 seconds, the contained steps must complete their execution before the 5 seconds expires, otherwise a timeout exception will be raised and the Business Process may terminate. Even though the contained Process Steps are executed on a background thread, the Timeout process step executes synchronously. The Business Process will not continue until either the contained Process Steps complete or a timeout occurs.
The Timeout Process Step is compatible with the use of transactions, such as transactional MSMQ topics. If a transaction is active when the Business Process runs, the contained Process Steps will execute within the context of the transaction that the Business Process is participating in. Failure of the contained Process Steps will cause the transaction to roll back and the message will be returned to the party’s message queue.
Although this cannot generally be used to abort a poorly constructed looping scenario, a cancellation token has been built into the context object which can trigger the termination of the processing occurring in the background thread. This will only happen between Process Steps.
For example, the Timeout Process Step would not terminate the following constructed loop if used in a C# Code Process Step:
while (true)
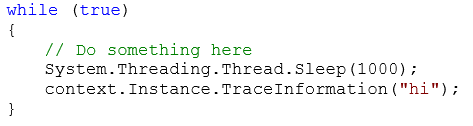
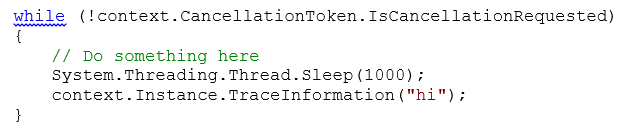
However, if the loop were reconstructed to use the Cancellation Token, the loop (and the background processing thread) will be terminated directly by the Timeout Process Step by using the IsCancellationRequested property of the CancellationToken object of the context object.
New Decrypt/Encrypt Message Process Steps
The Encrypt Message and Decrypt Message steps employ the XML Encryption standard to protect XML messages being sent between parties. The Encrypt Message and Decrypt Message process steps employ the AES encryption standard based on the Rijndael encryption algorithm to protect sensitive data from being exposed to unauthorized parties.
The Encrypt Message and Decrypt Message process steps will look up the encryption key from the Neuron ESB configuration. Developers may also specify a custom initialization vector that will be used to enhance the security of the encrypted data. Using the Encrypt Message step, it is possible to either encrypt the entire XML message, or to encrypt a fragment of the message specifying using an XPath expression.
New Sign/Verify Message Process Steps
The Sign Message process step uses the RSA algorithm to attach a cryptographic signature to an XML message. The Verify Message process step will use the same RSA algorithm to verify that a signed message is valid. Both the Sign Message and Verify Message process steps use X.509v3 certificates stored in the Windows certificate store and configured in the ESB configuration to sign or verify the XML message.
The Sign Message process step requires the presence of a private key attached to the certificate in the certificate store. Using the private key, the Sign Message process step will use the XML Signature standard to calculate the cryptographically-secure signature for the message and will add the signature to the XML body of the message.
The Verify Message process step will use the public key associated with a configured X.509v3 certificate to verify that the signature attached to an XML message is valid and was signed by the private key associated with the public key that is used to verify the message’s signature.